 FIG
1:
FIG
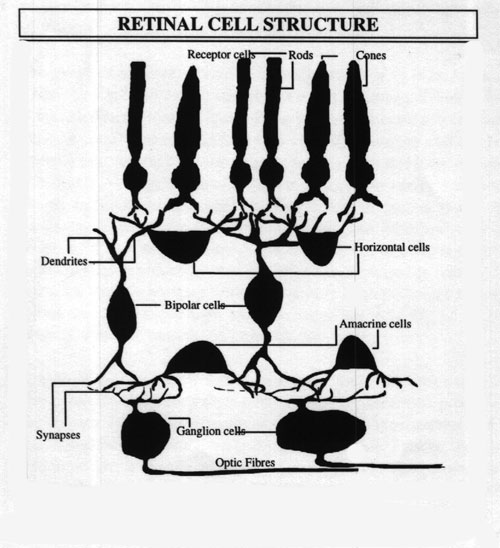
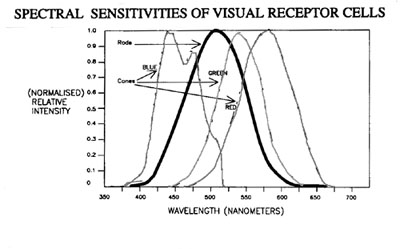
1: The human retina has two classes of light receptor cells: Rods, of which
there are about 120 million, and Cones of which there are roughly 6 million.
Rod cells are responsible for night vision and contain the pigment rhodopsin,
which is sensitive to levels of light about a thousand times weaker than
that needed to activate the cone system. The images obtained from the rod
system are very coarse and blurred. The cone cells on the other hand, are
responsible for the very finely detailed images we obtain from the fovea.
FIG
1: shows the structure of cells within the retina which is strangely
set up since the light receptors are actually at the back of the retina
and not facing the incoming light as one might suppose. They are divided
into three groups, each of which has a slightly different spectral response
roughly corresponding to the three primary colours of light. (See
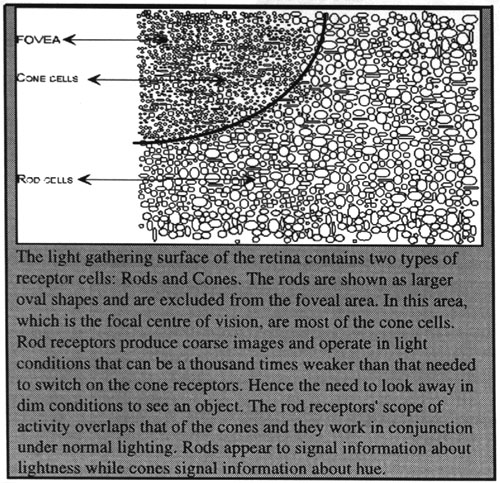
fig.3) The cone cells congregate exclusively in the foveal
region at the centre of vision while the rod cells occupy the peripheral
zone. Some cone cells, however, are scattered in the peripheral regions
of the fovea allowing for some colour outside of the centre of vision.
The positioning of the rods outside of the fovea accounts for our inability
to focus on objects that are dimly lit. Most people have noticed that in
order to observe a nocturnal object, they have to look away from it a little
and catch it using their peripheral vision.
Setting aside the vagaries of light adaptation, the eye has to inform
the visual cortex of the average illumination of the whole field the fact
that the, image surface contains both black and white sub fields. One of
those sub fields has a hard, contrasting edge and a soft edge which disappears
into the white background at a certain rate (Fourier Series). It would
appear that the retina does most of the processing work prior to passing
signals to the cortex. In the diagram
of the cellular structure of the retina
we observe six different types of cell: Rods and cones gather light input
and then output their information to the ganglion cells via the bipolar
cells. This is the main input-output pathway to the optic nerve. The horizontal
and amacrine cells mediate information, using the 1-DE
as an example, a receptor cell receiving input from about the middle of
this plane sends information down the bipolar cell to the ganglion cell
whilst simultaneously sending signals about local conditions laterally
across the retina to adjacent cells, thus modifying the output of the ganglia
to the optic nerve. Signals are sent back and forth, laterally, about the
intensity of incoming light. One imagines that if the neighbouring intensities,
as registered by each cell, fall within some 'difference' parameter they
will not be registered as an edge, they are merely part of a continuing
surface whose hue or tone happens to be changing. However if they turn
out to be greater than the difference parameter then an edge will be indicated.
Obviously under the former condition, with a gradual fading of black through
many greys to white there will be no edge detected but under the second
condition, at the 1-DE
edge,
the sharp difference in colour and tone will result in the detection of
an edge. A process called lateral inhibition has been proffered to account
for the inhibition of signals across the retina where edges are detected
t is not known whether this lateral inhibition actually takes place but
it is not implausible to suppose that an amacrine or horizontal cell might
switch itself off or into neutral when confronted with opposing strong
signals, from two or more of its dendrites.
This is known to be true of the ganglions. There are two distinct types
which both can be shown to have circular response fields that are either
excitatory or inhibitory (Fig.4).
In the centre of each ganglion response field there is a concentric field that is opposite in activity to the main surrounding field. Thus there are the 'On centre-off periphery' and 'Off-centre-on periphery' types.
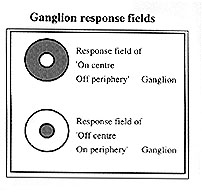 FIG 4:
Concentric fields typical of retinal ganglion and lateral geniculate
cells elicit an on response if a spot of light hits their 'on' fields and
conversely an off response if a spot of light hits the 'off field. These
cells normally fire signals without stimulus so an 'on' signal elicits
increased firing rates while an 'off signal is inhibitory. If equal spots
of light, hit one in the centre and one in the periphery, the response
is neutralized to normal firing.
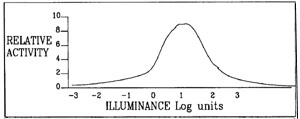 FIG 5:
The 1-DE
is the basis of the illusion and experiments have shown that the higher
the contrast between the 1-DE
and the background, the stronger is the illusory movement. Given that a
1-DE is black at its edge and gradually fades into the background, on a
scale of 20 evenly rising grades of grey from white to dark-grey there
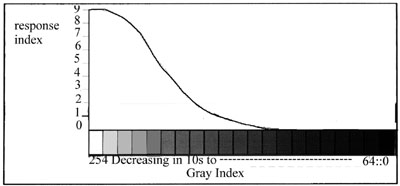
is a corresponding decrease in the activity of the illusion. The graph
in Fig.? shows a response curve for a field composed of black 1-DEs
superimposed onto backgrounds of varying shades of grey.
In this test, subjects determined grades of activity for each grey
field by allotting a number between 0 and 9. An allotment of 0 was given
to fields on a black background and then ranging to 9 for fields on a white
background. This assumed a value of 0 for no activity and 9 for maximum
activity. Illuminance of the test fields was constant. A basic problem
with any measurements of response for the visual system is that responses
are very much subject to the light and dark adaptation
of the eye to the illuminance of peripheral objects and surfaces as
distinct from the actual object or surface under scrutiny. This means that
it is difficult to get truly accurate results to apply generally to all
manner of circumstances and environments.
The graph of relative activity to illuminance (Fig.5)
is an extrapolation from data collected in 1988 in
a non-standardised environment and using an image different from the
one used at present ie Fig.l. It
is included here because it shows an interesting peak activity and
fall off both in the dim, near
twilight conditions around Log 0 to -1 of illuminance and a corresponding
fall off when the light
became very bright at around Log 2 to Log 3. A test (test 'A') is at
present being set up using a
standard test image in standardised conditions to verify these results.
Another test (test 'B') using the
twenty backgrounds of evenly graded shades of grey is also being prepared.
The different
backgrounds will have the effect of varying the reflected illumination
and therefore the illuminance
of the field, the test is to determine whether the relative activity
of the illusion, under constant
ambient lighting, corresponds with the results found in test'A'. Still
another test (test'C') will
combine relative activity with the variable illuminance of twenty shades
of grey and a lighting source
which casts a variable light over the range log -3 to log +3. A 3-dimensional
graph will map the test.
Results will be available on completion.
CONTRAST ILLUMINANCE AND RESPONSE
Processing of the 1-DE Field.
Inspite of the incompleteness of the tests, there is enough information
to make conjectures that can direct preparations for future experiments
to determine possible reasons for this illusion of movement. Initial thoughts
point to two separate processes that initiate the illusion. The first involves
the retinal cells. There are a few reasons for this: Firstly, the illusion
doesn't work at the centre of vision, in the fovea where there are no rod
cells. The properties of movement diminish at the lower
end of the cone receptor threshold and also at the upper end of the
rod receptor threshold. This is evident on the one hand as the illuminance
gets so low that the activity of the cone system is minimised ie. when
colours are only slightly discernible. On the other hand, as the illuminance
increases close to the rod saturation threshold the illusory movement slows
down and even stops. Colours are still plainly discernible so the cone
system is still active indicating that both rod and cone signals are required
to filter down to the ganglions in order for the illusion to work. No single
receptor type can accommodate the illusion. From the receptors signals
pass along interconnections across the retina where edges and continuous
surfaces are defined. These are then processed by the ganglia into relative
on, off and neutral signals. Logically, the 'on off signals would herald
an edge and the 'neutral' signals indicate a continuing surface, the strength
of the signals having something to do with hue and illuminosity. I would
suggest at this stage that the ganglions representing the 'dissipation
plane' of the 1-DE
tend to manufacture their own information since they are interconnected
via the amacrine cells. If the firing rate from ganglion to ganglion is
changing as one travels from the hard edge of a 1-DE
across the dissipation plane, interconnecting signals would tend to smooth
them out by actually carrying the signals further along thus putting in
information that doesn't exist in that region. All this, as long as the
change in signal strength doesn't exceed a threshold that signals the presence
of an edge. Such an action might be called a 'Continuance Effect'. Secondly,
in the visual cortex, the association between simple cells and complex
cells is such that a single complex cell can receive input from a large
number of simple cells that all have matching orientation sensitivities
and matching 'on off areas. The transference of input into the complex
cell, from one simple cell to the next, requires a movement down a cortical
column or across to another column with cells of the same orientation sensitivity.
If the simple cells in a column are interconnected a similar continuance
effect, this time for edges, may enhance the illusory movement initiated
by the ganglia.
![]()
Last Revised: 30/12/99
 FIG
2: Retinal Surface.
FIG
2: Retinal Surface.
 FIG
3:
FIG
3:
 FIG
6:
FIG
6: